
What's Our Forecast?
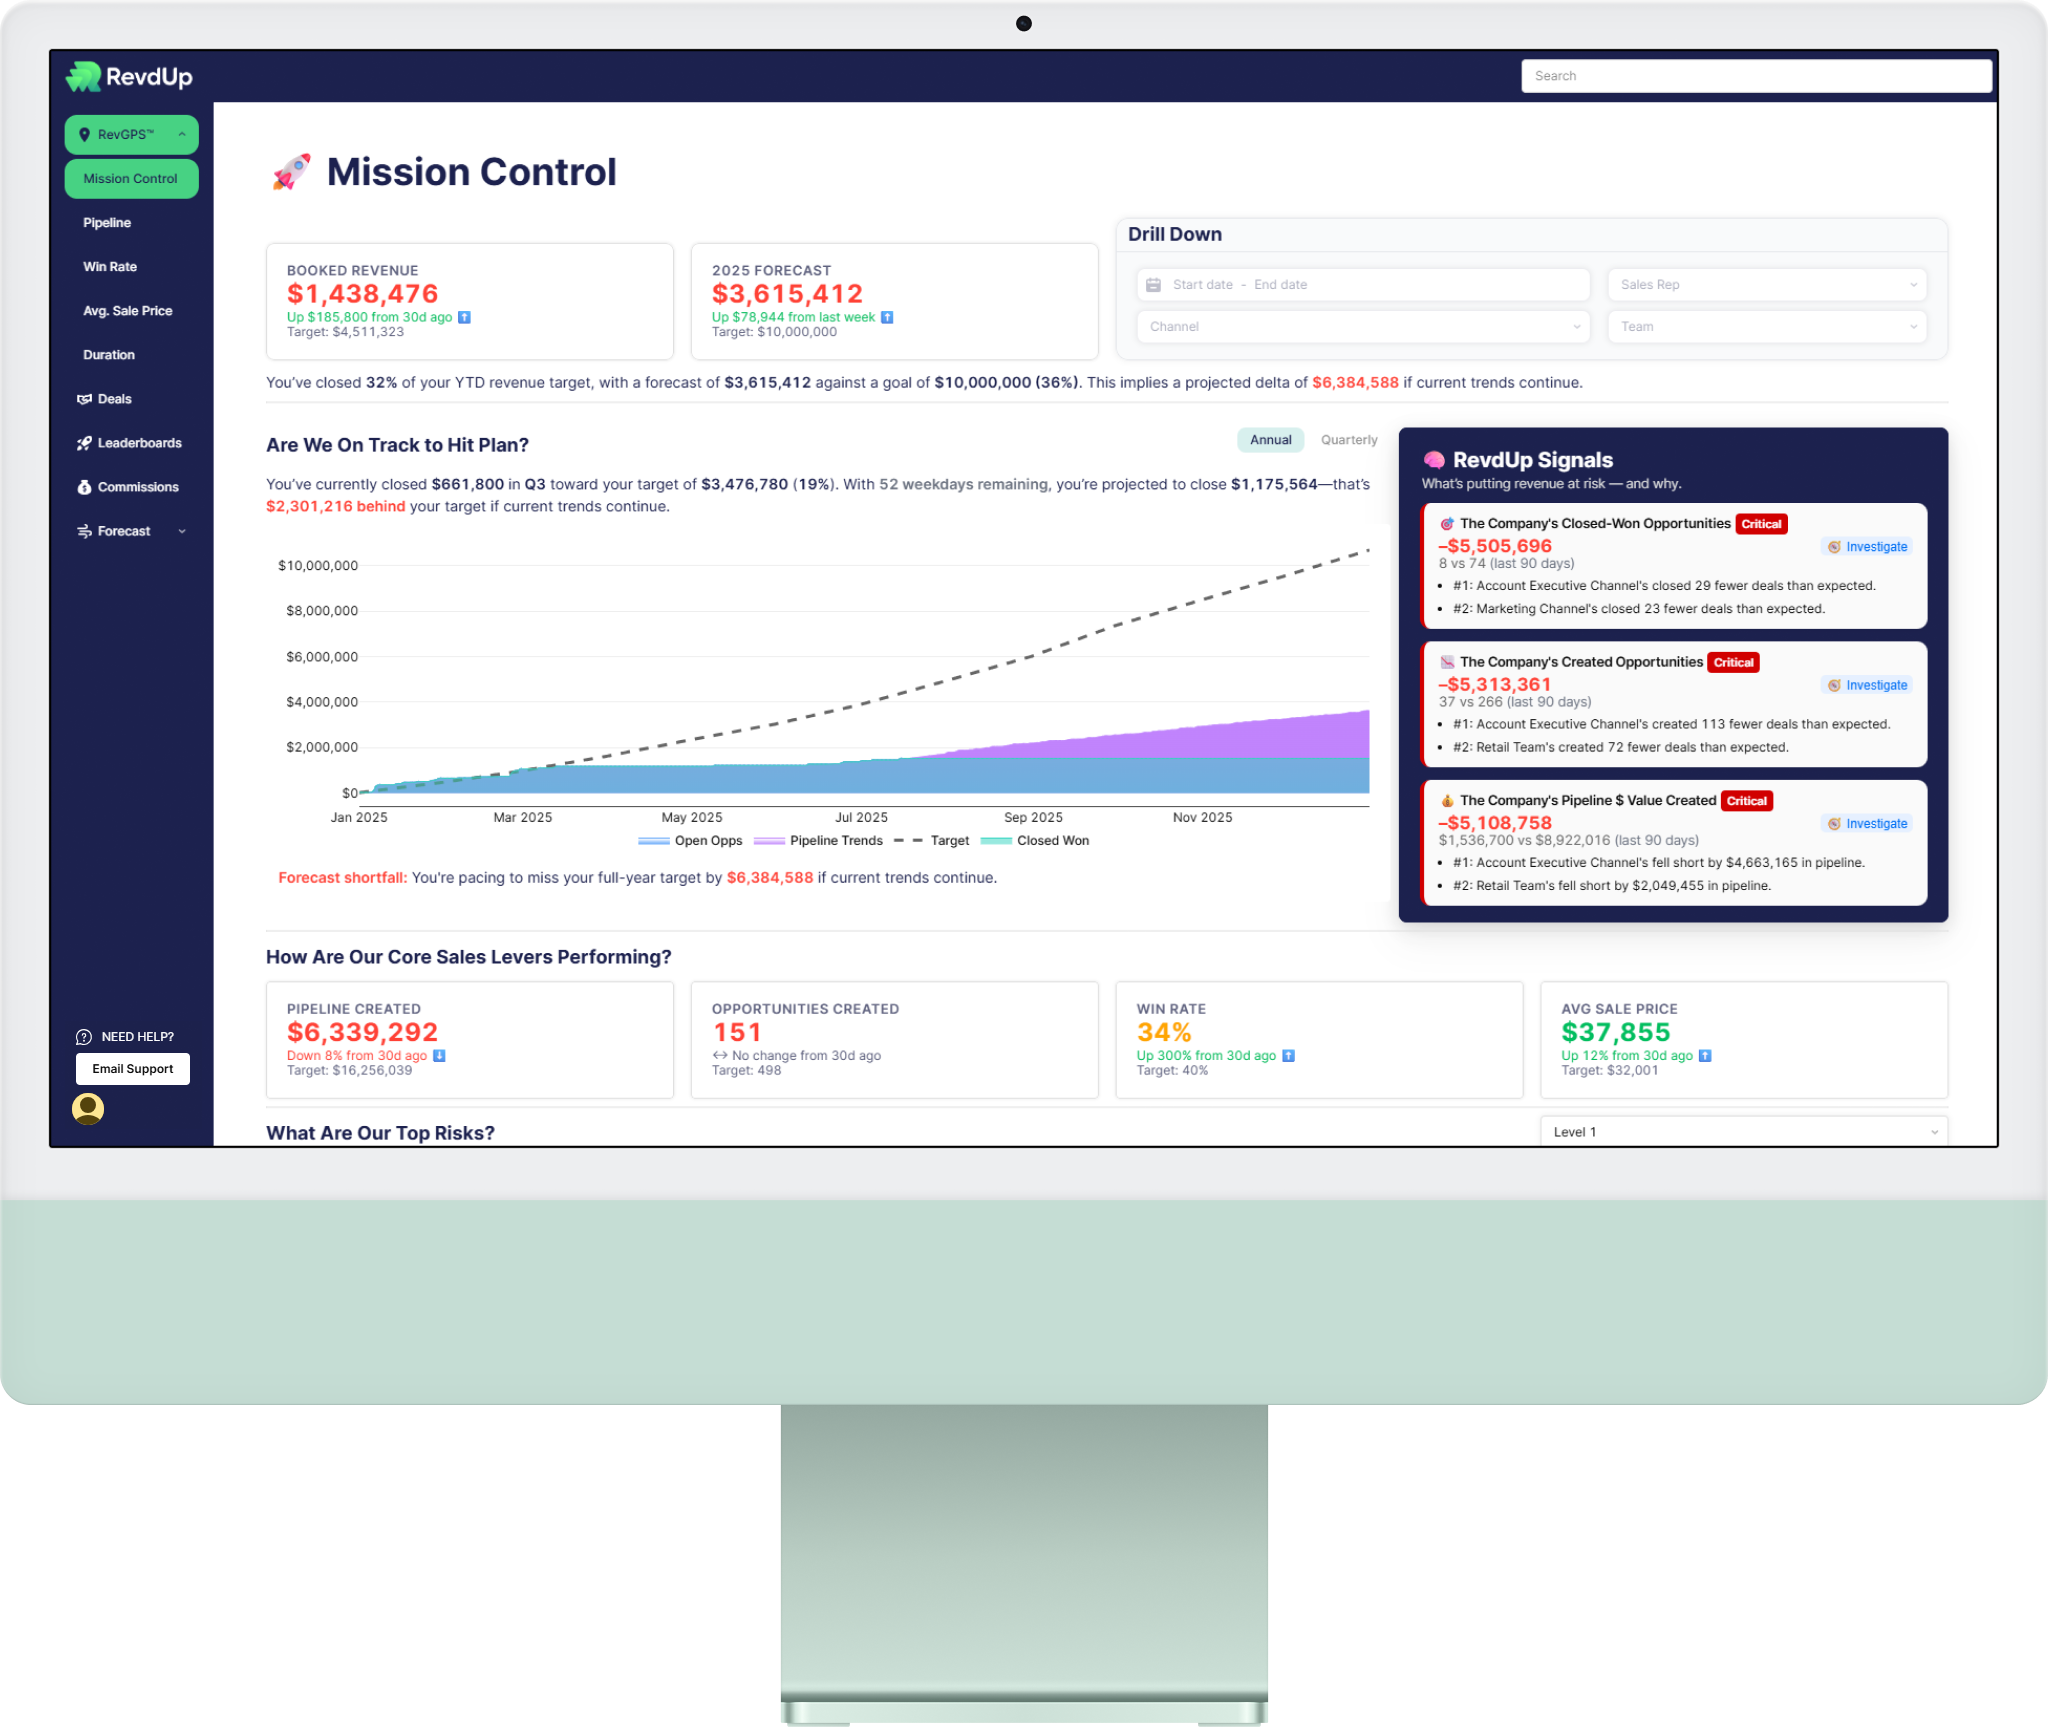
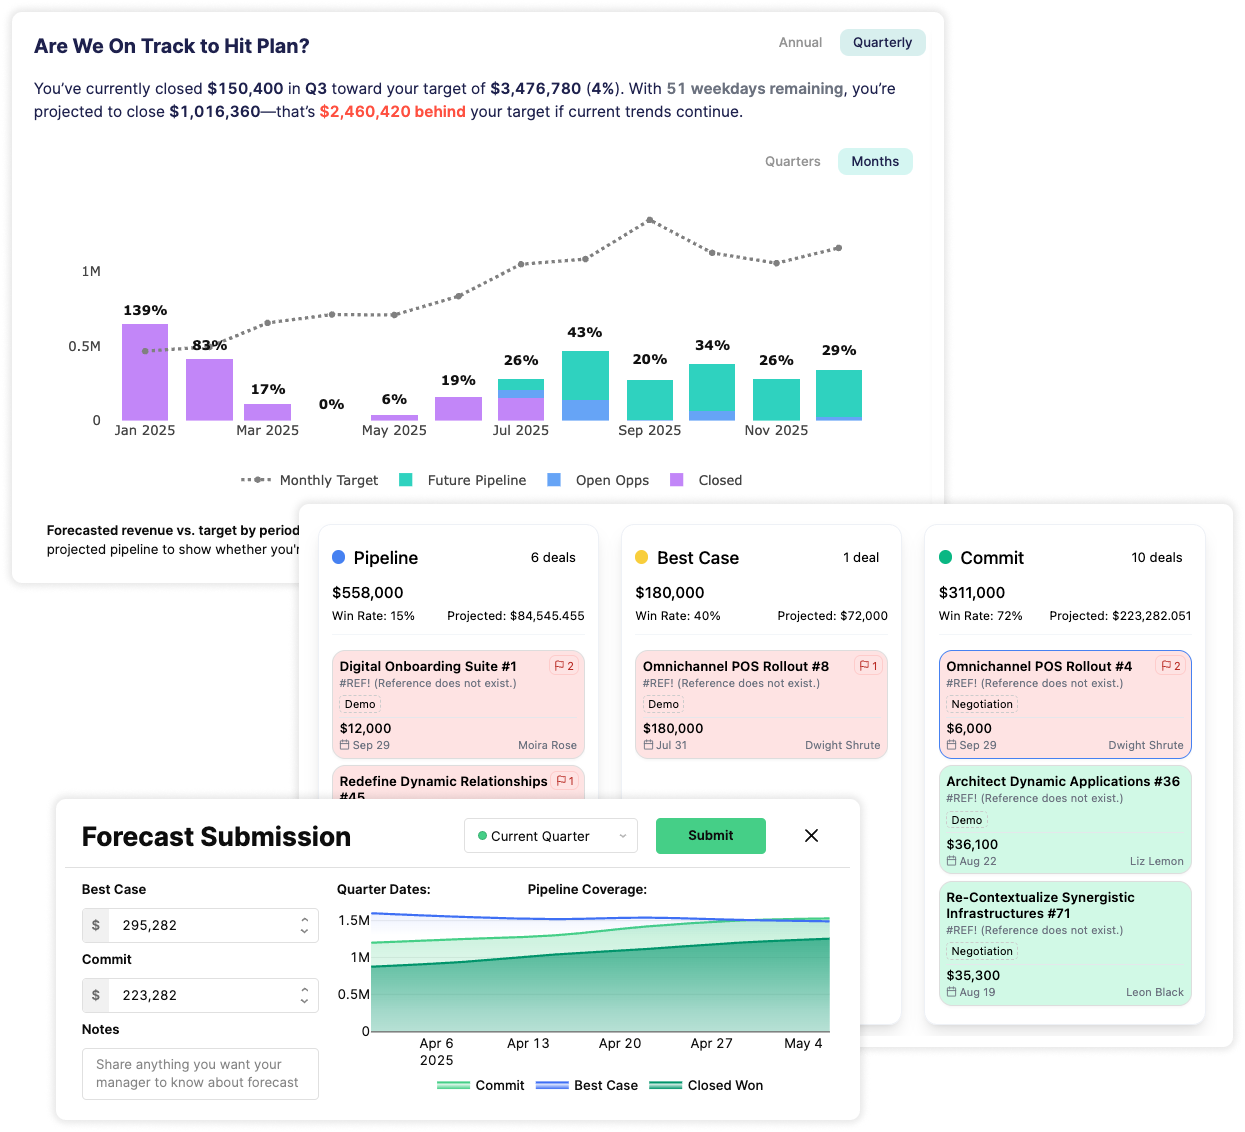
RevdUp combines three forecasting methods to give you the clearest picture of where you’re likely to land:
Weighted forecast uses deal-level probabilities to project revenue across three sources: closed-won deals, open pipeline, and future opportunities that haven’t been created yet — giving a comprehensive view of how much revenue you’ll drive.
Rep-submitted forecast allows reps to drag deals across forecast categories w/ at-risk deals highlighted and Best Case and Commit forecasts suggested. Managers get roll-ups by rep and team, each with a Forecast Reliability Profile, highlighting optimism and sand-bagging.
Scenario forecasting uses 1,000+ probability-weighted simulations to show the full range of outcomes — so you know how likely you are to hit various targets.

What's off — and why?
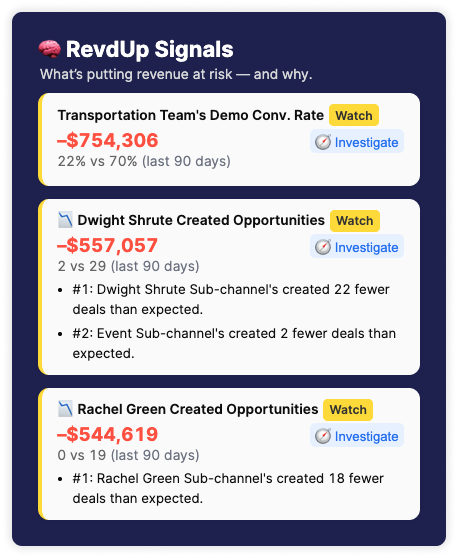
RevGPS audits every GTM KPI — volume, value, conversion, and duration — across the full customer lifecycle, and at every level of the org. Each metric is benchmarked against plan, past performance, and peer benchmarks to highlight what’s pacing behind and where things are slipping.
From there, RevGPS drills into each gap to surface the underlying drivers and list the top reasons each KPI is under-performing. It’s root cause analysis done automatically — no digging, no guesswork.

What Should We Prioritize Fixing?
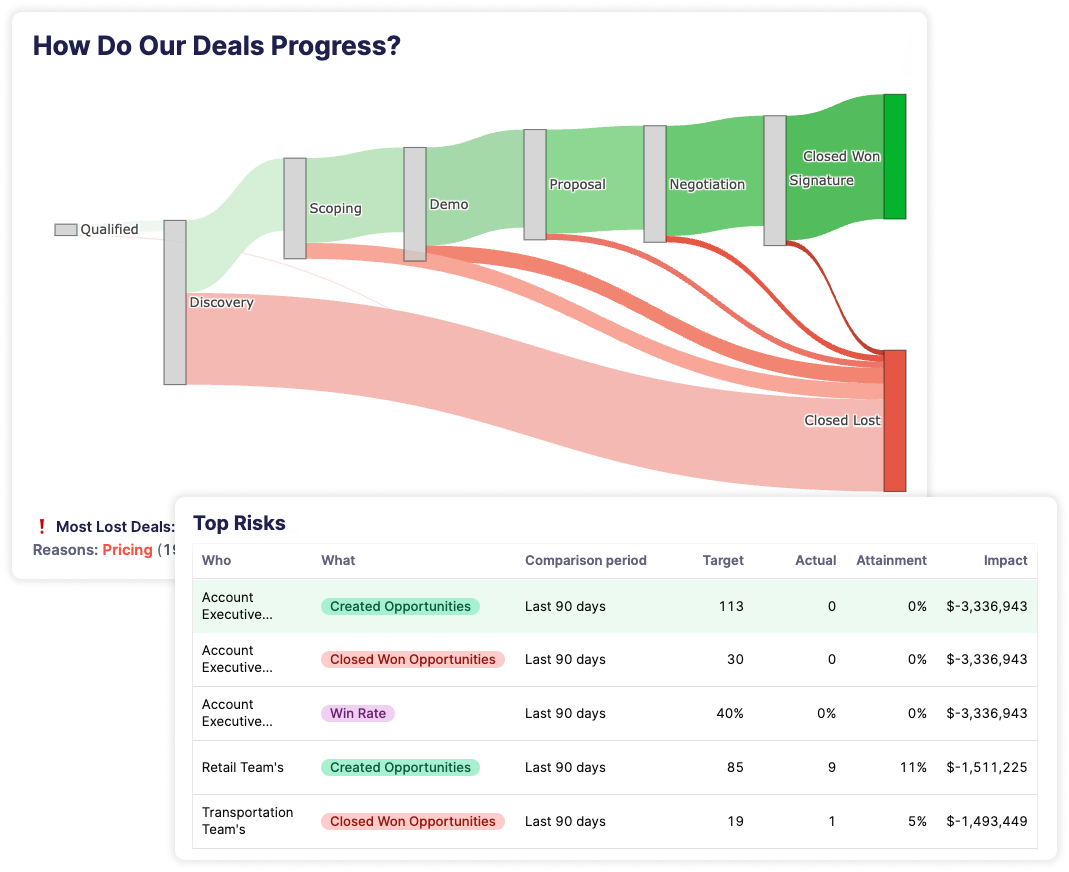
Not every gap is worth fixing. RevdUp quantifies the revenue impact of every KPI shortfall, so you know exactly which metrics are dragging down your forecast — and how much they’re costing you.
The Revenue Impact Engine calculates Impact on Revenue (IoR) by projecting how each hit or miss will affect your remaining target if current trends continue. The result is a ranked list of what matters most — by revenue impact.
This lets you focus your time, coaching, and resources where it will actually move the number. No guesswork. Just clear guidance on what to fix first.

What's Going On In Our Pipeline?
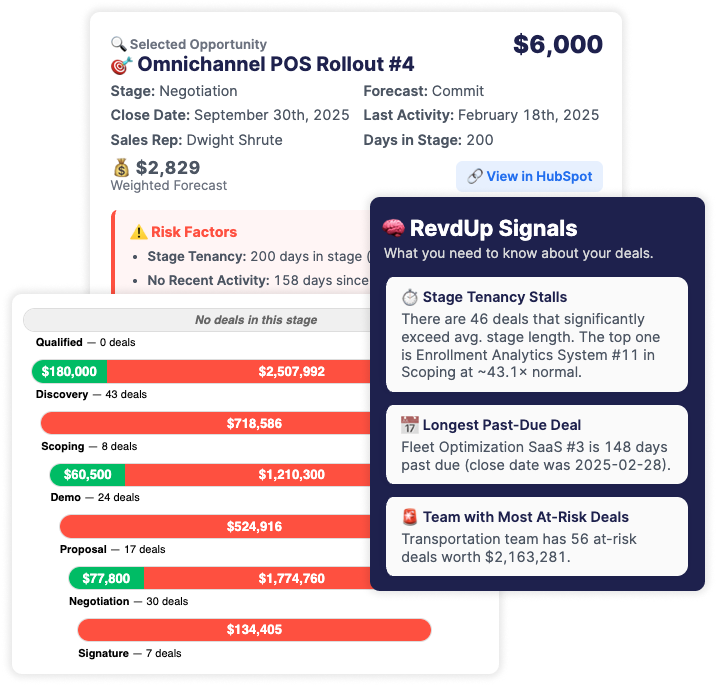
Pipeline Pulse gives managers and reps a real-time, prioritized view of their pipeline — including which deals are at risk, and why. You can filter at-risk deals by stage, time horizon, or team, and quickly drill into the drivers behind each risk flag.
RevdUp automatically highlights issues like past-due close dates, stalled stage tenancy, lack of recent activity, and repeated close date pushbacks — all of which signal deals that are slipping or losing momentum.
We call it the “Clean Up Your Room” dashboard — purpose-built to improve CRM hygiene, coach reps toward better pipeline habits, and make sure nothing important falls through the cracks.

How Can I Hit My Financial Goals?
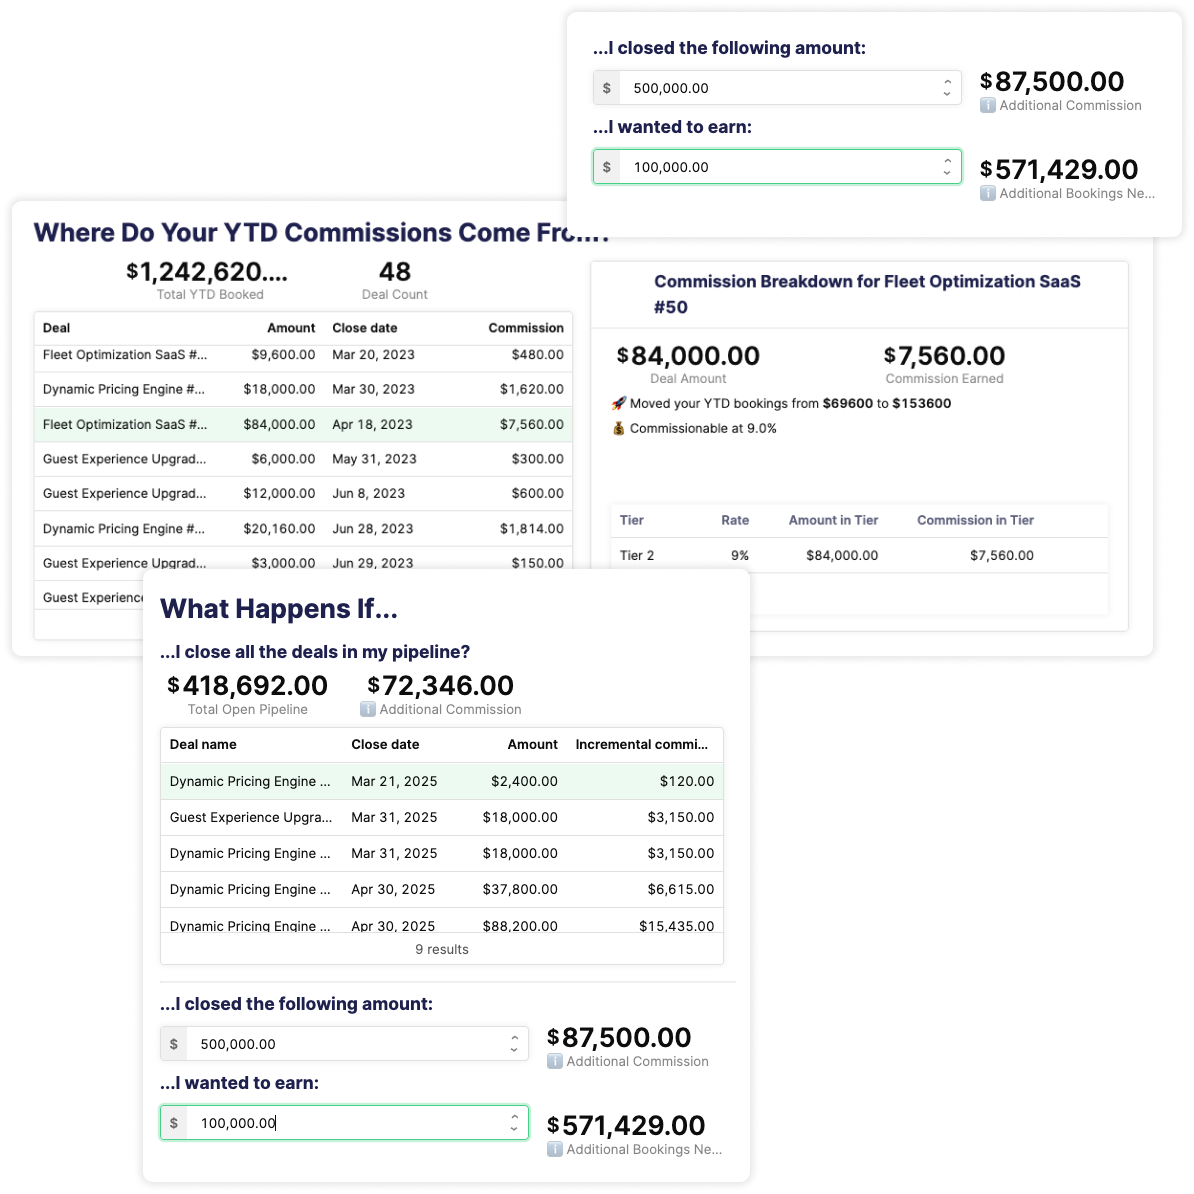
The first step to peak motivation is knowing what’s possible. RevdUp’s Commissions view shows reps exactly what they’ve earned — and what they could earn based on the pipeline in front of them.
They can model potential payouts, see commission value by deal, and model different scenarios to understand what it’ll take to earn what they want.
All of it lives in the same place they already go to submit forecasts — so they stay focused, fired up, and in control of their outcomes.
